
New York’s sports betting industry continues to generate staggering numbers. The milestone of $25 billion wagered was passed as the first quarter of the state’s fiscal year closed with $983.5 million having swelled the state’s tax coffers.
But if we step beyond the headline figures and consider how New York’s sportsbooks are really doing, can we draw any conclusions as to how sustainable all this is?
For the casual sports fan, online betting is a simple business. You stake $X in the hope of returning $Y. Over time, if the total of $Y is greater than the total of $X then you’re into the happy days of profit. If not, then shucks you might go again (remembering to stick within your limits) or you’ll duck out.
The same principle applies to gambling companies, albeit in reverse. But, consider that the biggest sportsbooks in the US have millions of customers and every single market advertised every day has to be assessed according to risk.
Sportsbooks constantly monitor a vast array of metrics and KPIs. As bettors, we’ll never be privy to the majority of these. Yet, just looking at some publicly available figures gives us a degree of insight into how well a betting brand is performing and how much of those hard-earned bucks we wager end up as wins or losses.
Some of the most important metrics in online gambling are sat there in plain sight. To most, they just look like a jumble of figures, but with a little analysis and explanation, we can draw some conclusions as to the current health of the New York sports betting industry and the betting companies operating within it.
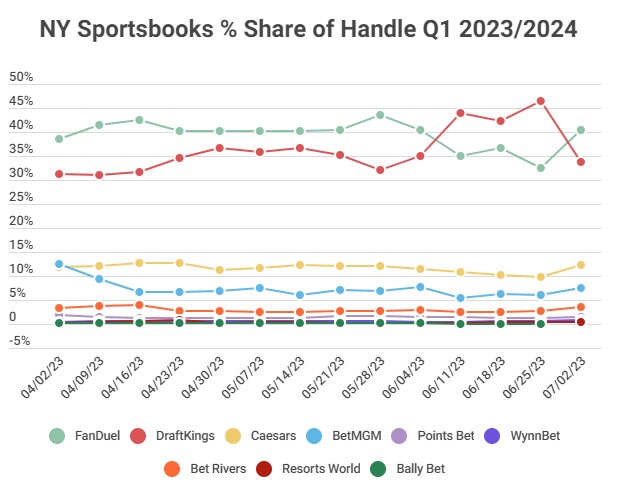
You may have already come across the term ‘handle’. The handle is the total amount of dollars wagered with a sportsbook in a given period.
Handle is simply the betting industry’s equivalent of income and is different to revenue and profit. Handle is often a headline-grabbing number, but one that doesn’t always tell us what’s going on beneath the surface.
It’s a bit like a plucky entrepreneur on Shark Tank pitching that their business has achieved an impressive first-year revenue number and is seeking further investment for a per cent share of their business. Often though, when Mark Cuban and the crew delve further into the company’s finances they uncover murkier depths.
Before we dive into what might lie beneath, here’s how weekly handle figures shaped up for NY’s sportsbooks in Q1:
As described above, betting handle isn’t that much use when we’re discussing how well a sportsbook has performed. After all, if a betting operator takes $1 million in wagers in a month but pays out $1.5 million, then they haven't done well after all.
That’s why GGR can be a more useful number. GGR is the amount a sportsbook received in wagers minus how much it paid out to customers in winnings. GGR is a measure of revenue for companies in the gambling industry and is also often referred to as ‘hold’.
As an example, for Super Bowl LVII, New York’s sports betting companies ‘held’ 5.6%. It’s worth noting that according to the American Gaming Association, the nationwide sports betting sector had a hold rate of 8% in 2021 and that rose to 10.5% last year.
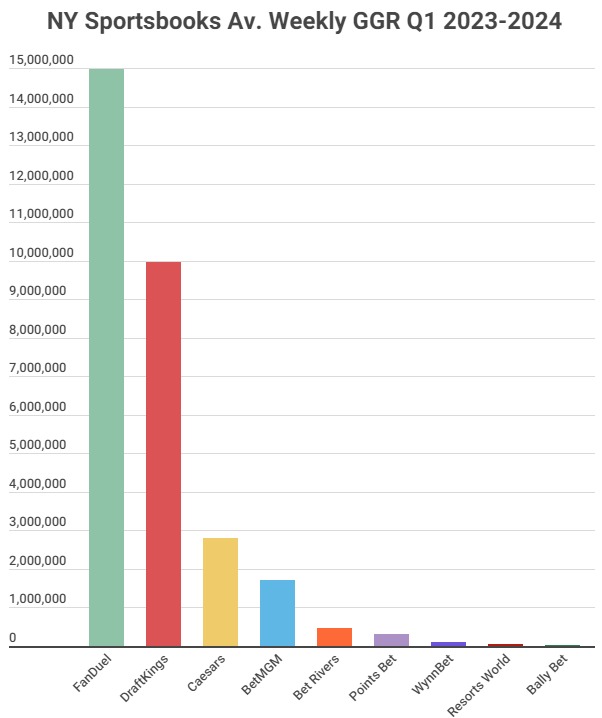
As you can see below, FanDuel has long been the envy of its sportsbook peers for posting impressive hold figures.
Here’s how New York’s nine legal sportsbooks looked for GGR in dollar terms in Q1:
There are a whole host of other factors that would indicate whether a betting firm is operating successfully or not. These include Net Gaming Revenue (GGR less bonuses and free bets), customer retention rates, number of first-time depositors and churn (how long players stick around).
Gambling firms rarely give any insight into these KPIs so we’re stuck with what we’ve got. We can work out Gross Gaming Revenue Margin (GGRM) though. GGRM is GGR as a percentage of the total amount gambled (handle).
Sports betting is a high volume-low margin sector in the overall gaming industry. That is particularly true when comparing it to online and brick-and-mortar casinos.
A 10% to GGR: Handle ratio is a standard that sportsbooks aim to achieve as a minimum, so it’s interesting to note GGRM stats for New York’s online sports betting brands:

Naturally betting companies seek to maximize GGRM. To an extent, it also follows that a lower GGRM is more attractive to customers as an indication of their chances of winning bets. A whole load of other noise applies to GGRM though such as big wins skewing a sportsbook’s overall number.
Nonetheless, perhaps the trends identifiable in the chart above should sway more customers to smaller sportsbooks, such as WynnBet New York.
Ultimately, picking which book to play at is a balance between which will provide the best odds and so the best potential for profit, which GGRM figures can guide us on; which has the best sportsbook promos; and which you simply find the most enjoyable to use.


